Phoenix metro’s June median listing price was $489,500, while 28.7% of listings carried a price cut—useful context for property-specific negotiation.



The market journal · Reviewed August 12, 2026
Three landscapes.
One clear perspective.
A current, carefully sourced guide to desert, mountain and coast—made for thoughtful decisions rather than hurried conclusions.

Current, not performatively live
Every number has a date.
This is a date-stamped market briefing, not an automatic MLS ticker. The newest comparable public housing snapshots are for June 2026 and were released in July; population figures use the newest official 2025 estimates. For a property decision, Nico reviews the then-current authorized MLS record and property-specific evidence.
Original photography © Nicholas Hanley
01 · Sonoran modern
Greater Phoenix
at a wider horizon
Greater Phoenix is not Los Angeles or Orange County transplanted into the desert. It is the Sonoran Desert’s own wide-reaching metropolitan region: Phoenix, Scottsdale, Tempe, Mesa, Chandler, Glendale and neighboring cities connected by major medicine, universities, culture, destination retail, resorts and extraordinary preserves.
5,228,938Phoenix–Mesa–Chandler metro residents · July 1, 2025 estimateU.S. Census Bureau ↗
$470,000Phoenix city median sold price · June 2026Realtor.com Economic Research ↗
+8%ARMLS closed-sales change year over year · June 2026ARMLS ↗
June 2026 market pulse
More movement, with room to negotiate.
ARMLS reported closed sales 8% above June 2025, while noting that roughly five percentage points reflected an extra business day. Active inventory was 5% lower year over year. That combination rewards property-specific pricing and careful negotiation—not a one-size-fits-all headline.
Read the July 2026 ARMLS report ↗Common decision points
What people tend to evaluate
- Total monthly cost—not price alone—including HOA, insurance, utilities and maintenance.
- Commute pattern, lock-and-leave needs, lot size, new-build timing and resale flexibility.
- Recent comparable sales and the share of competing listings requiring price reductions.
What's hot · data, not hype
Signals worth watching
ARMLS reported June closed sales 8% above the prior year, but noted that calendar effects explained much of the gain; condition and pricing still lead.
Single-family, condo, townhome, land and new construction should be read separately; a metro median is not a substitute for a property-type analysis.
Maricopa and Pinal counties remain major population-growth areas; infrastructure, commute and service access should be checked alongside the home.
A sense of place
Landmarks, culture + landscape
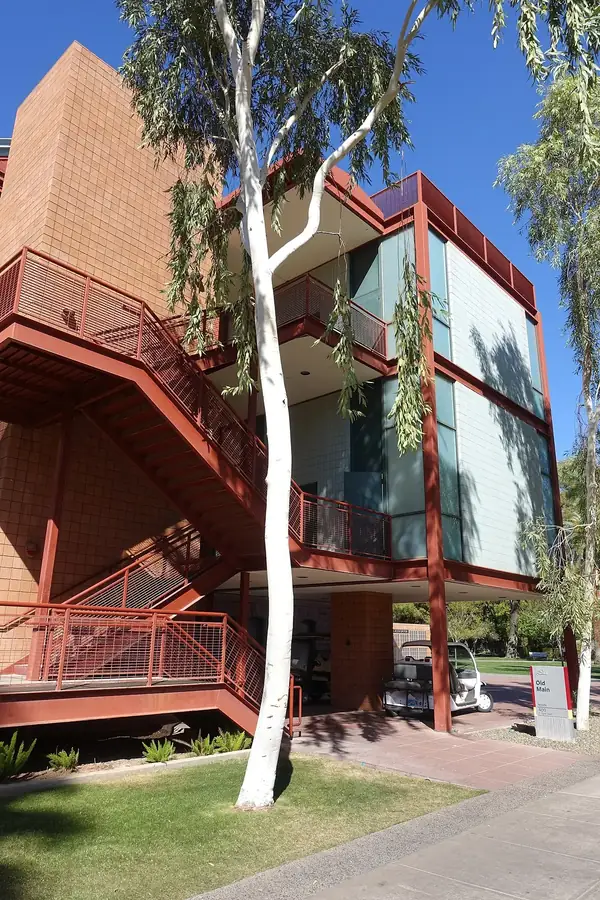
Original photography © Nicholas Hanley
02 · High-country perspective
Northern Arizona
by elevation and season
This Coconino County–centered Northern Arizona market moves from high desert and grassland into ponderosa pine, volcanic field, plateau and alpine terrain. Flagstaff is the university and high-country hub; Williams, Tuba City, Tusayan, Mountainaire, Kachina Village, Munds Park and the Coconino County portion of Sedona each bring distinct questions about access, utilities, weather, wildfire exposure, land status and seasonal use.
149,453Coconino County residents · July 1, 2025 estimateArizona OEO ↗
$676,000Coconino County median sold price · June 2026Realtor.com Economic Research ↗
1,986Coconino County homes for sale · June 2026Realtor.com Economic Research ↗
“Northern Arizona” is a practical market description, not a single official population boundary. This page therefore uses Coconino County data and excludes Yavapai County data; Flagstaff’s July 1, 2025 estimate was 79,796. Sedona straddles both counties, so only its Coconino County portion is within this guide’s stated scope.
NAAR + Flexmls market orientation
Coconino County–centered, community by community.
FlagstaffWilliamsTuba CityTusayanMountainaireKachina VillageMunds ParkSedona · Coconino County portion
This is Nico’s service-area description for this guide—not a claim that NAAR publishes a formal county boundary. The association provides the Northern Arizona MLS/Flexmls context; county and community facts remain linked to their originating public sources.
June 2026 market pulse
A market that requires local comparables.
Realtor.com Economic Research reported a Coconino County median sold price of $676,000 and a 58-day median market time in June. Those countywide figures blend distinct communities and property types, so pricing in Flagstaff, Williams, Tuba City, Tusayan, Mountainaire, Kachina Village, Munds Park or the Coconino portion of Sedona must begin again with the specific property.
View the Coconino County data ↗Common decision points
What people tend to evaluate
- Year-round access, snow service, utilities, well or septic systems and four-season maintenance.
- Wildland interface, insurance availability, elevation, slope, drainage and property-specific inspections.
- Legal access, land status, HOA or rental rules and recent comparable sales within the same micro-market.
What's hot · data, not hype
Signals worth watching
Coconino County offered 1,986 active listings in June with a 58-day median market time, supporting a careful comparison of condition and carrying costs.
Homes sold at 98% of asking price countywide in June. That is a broad ratio—not a promise—and accurate micro-market pricing remains essential.
Cabins, condos, land and year-round homes each carry different access, maintenance, utility and insurance questions; countywide figures blend them.
Flagstaff’s 2025 estimate reached 79,796 residents. The wider service area is presented with Coconino County—not Yavapai County—statistics, so planning should stay community- and property-specific.
A sense of place
Landmarks, culture + landscape
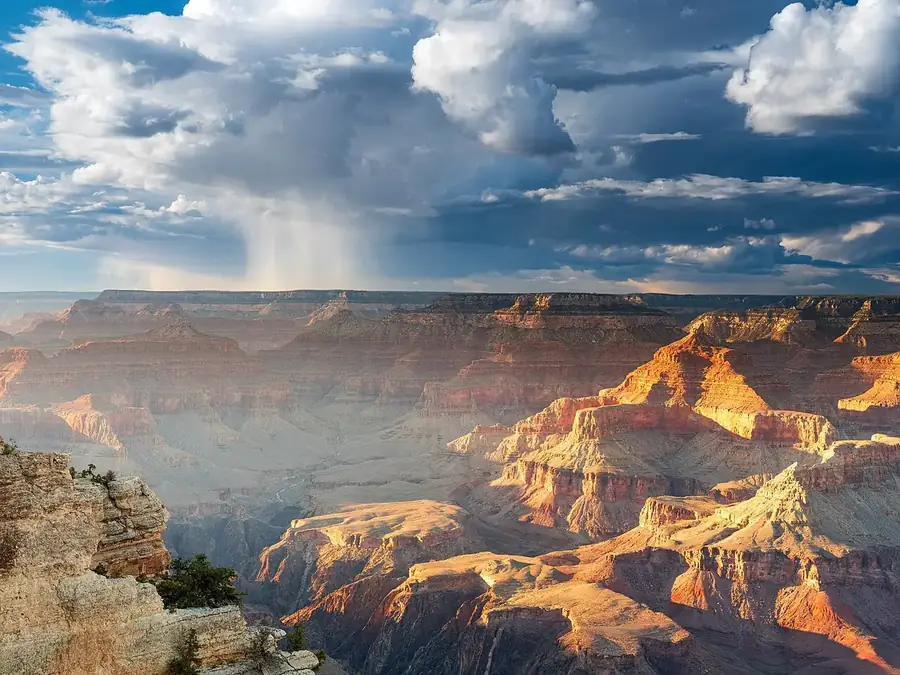
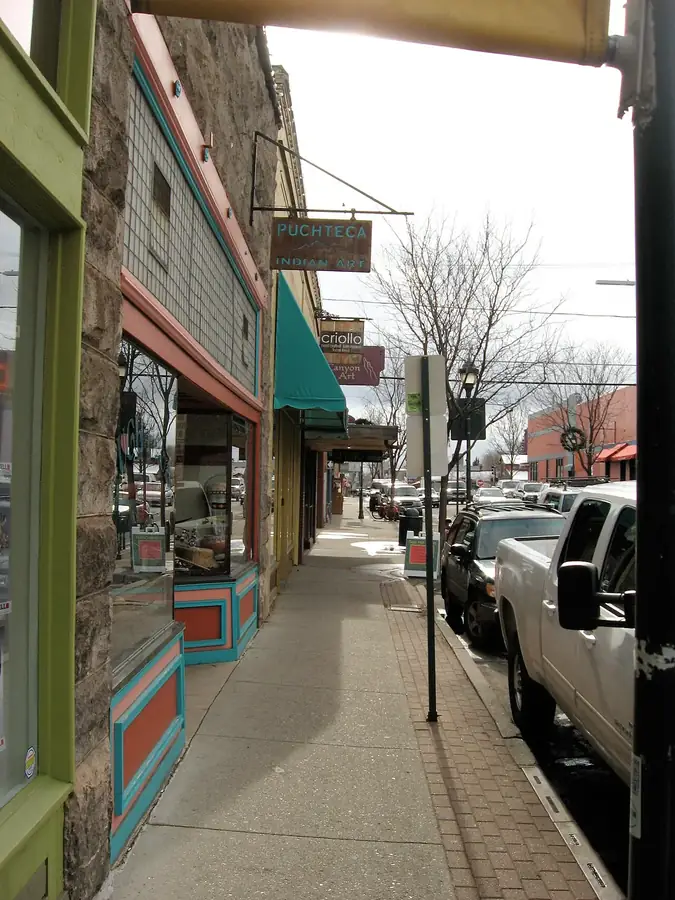
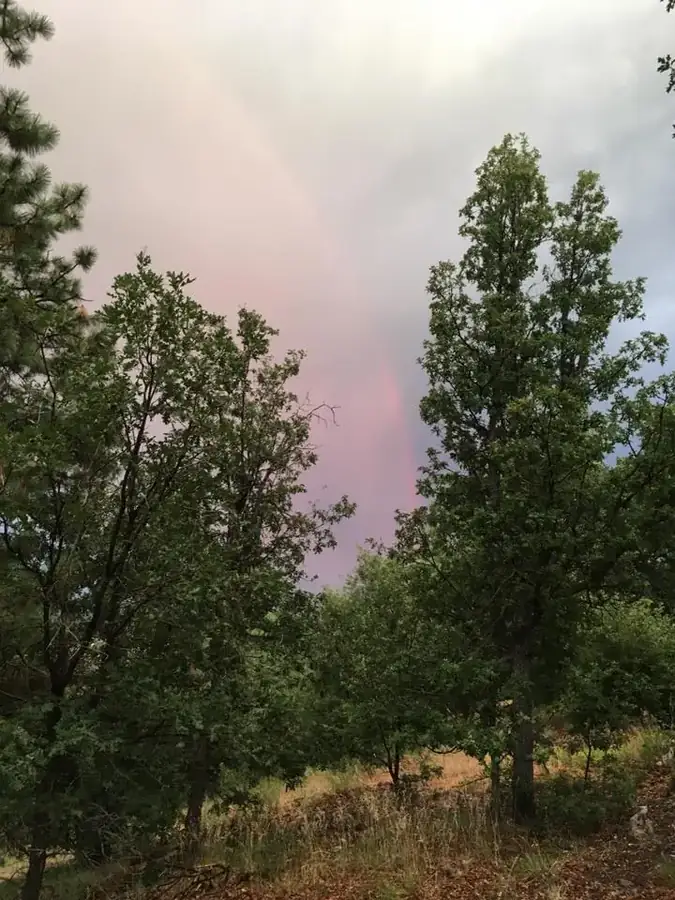
Original photography © Nicholas Hanley
03 · Pacific composure
Orange County
coast, city and canyon
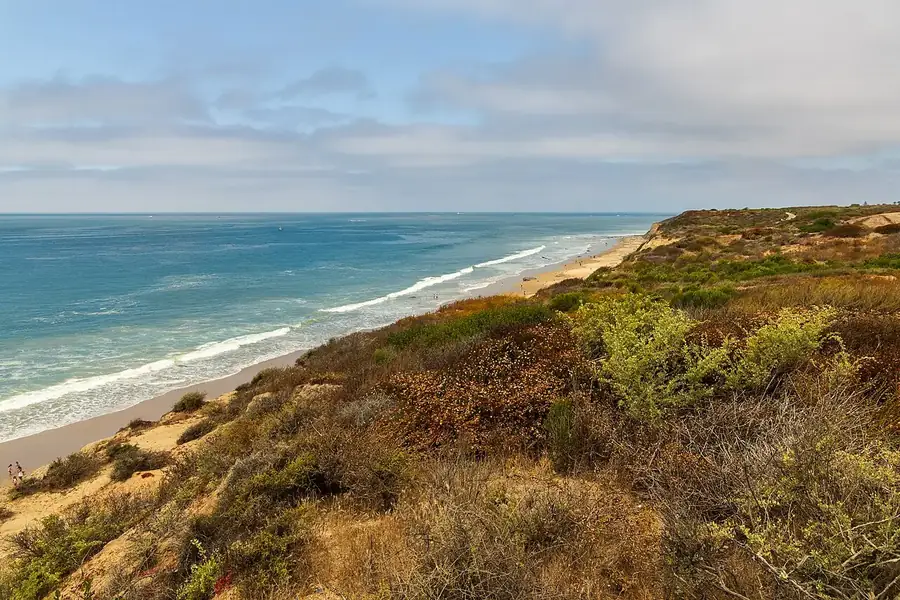
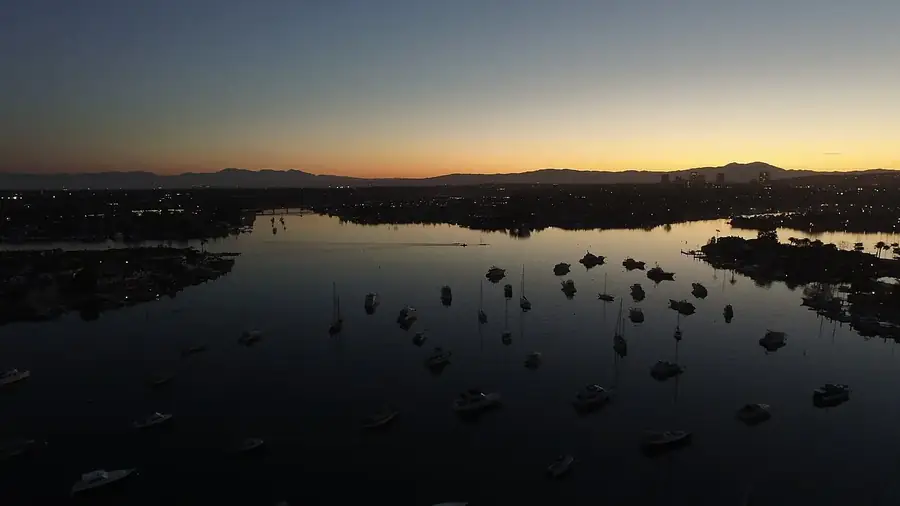
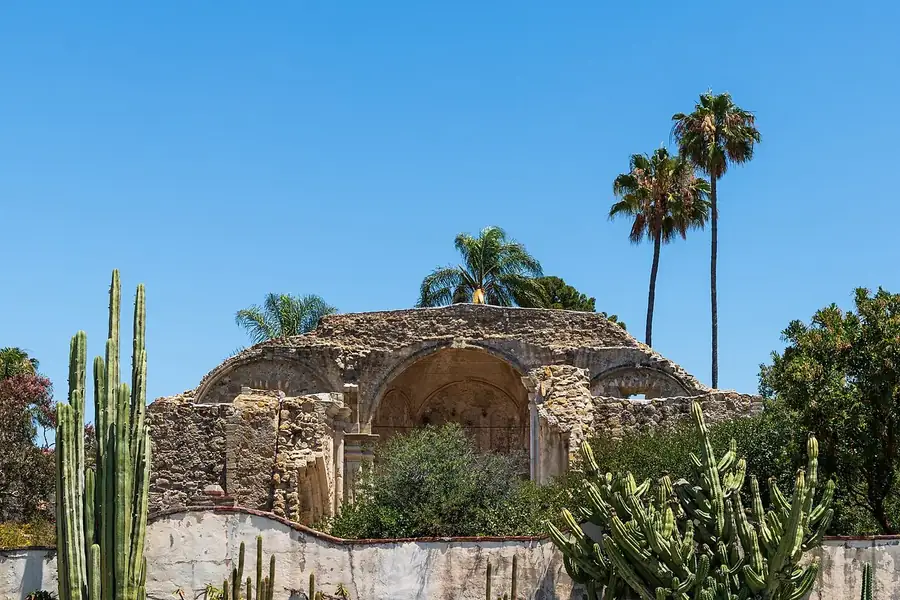
Orange County is one county with many tempos: coastal communities, planned cities, hillside and canyon settings, established suburbs, major employment centers and globally known culture, retail and recreation. The useful comparison is never simply “inland or coast”; it is the complete fit of housing, budget, transportation, insurance, maintenance and daily rhythm.
3,149,507Orange County residents · July 1, 2025 estimateU.S. Census Bureau ↗
$1,490,000Existing detached single-family median price · June 2026California Association of REALTORS® ↗
+12.2%Detached single-family sales change year over year · June 2026California Association of REALTORS® ↗
June 2026 market pulse
High values, with more completed sales.
The California Association of REALTORS® reported a $1.49 million median price for existing detached single-family homes in Orange County, up 1.4% from June 2025, while sales were 12.2% higher year over year. Condominiums, townhomes and individual cities require their own analysis; this county median is not a home valuation.
Read the C.A.R. June 2026 report ↗Common decision points
What people tend to evaluate
- Total monthly ownership cost, including HOA, insurance, maintenance and any disclosed special assessments or Mello-Roos obligations.
- Housing type, transportation pattern, coastal conditions, wildfire or hillside factors and practical maintenance needs.
- City- and property-type comparables; detached-home medians do not describe condo or townhome values.
What's hot · data, not hype
Signals worth watching
Orange County carried about 8,000 active listings and a 45-day median market time in June; the countywide sale-to-list ratio was about 100%.
Existing detached-home sales were 12.2% higher than June 2025, while the median price rose 1.4%; local condition and city-level evidence still govern.
Detached homes, condos and townhomes must be separated. The $1.49 million C.A.R. figure applies only to existing detached single-family homes.
Orange County’s 2025 population estimate was 3,149,507 within an 18.44-million-person Los Angeles–Long Beach combined statistical area.
A sense of place
Landmarks, culture + landscape

A calm point between places
A good move begins like a good journey.
With a clear map, an honest pace and room to notice what matters.
I have worked in real estate since 2016 and am licensed in Arizona and California. My education in criminology and criminal justice, human rights, and doctoral study in Global Leadership & Change shapes a careful, people-centered approach: listen first, explain plainly, document the details and keep the client’s goals in view.
Whether the plan is a first purchase, a sale, a lease, a lower- maintenance home, a second property or a move between desert, mountains and coast, I help turn many moving parts into a composed next step—perhaps beginning, quite simply, over a good coffee.
Begin the conversation →Professional + ethical framework
Useful context, carefully bounded.
Fair housing
Services are offered without discrimination and subject to federal, state and local fair-housing laws. Housing guidance is based on objective property criteria and the client’s own stated needs. Nico does not characterize communities by protected classes or use coded steering language.
Market data
Statistics are snapshots from the linked sources, may be revised, and may define property types or boundaries differently. No figure guarantees a price, return, appreciation, availability, timing, financing approval or future market condition.
Places + landmarks
Landmarks are included only for geographic and cultural orientation. Inclusion is not an endorsement, claim of proximity, promise of access or statement about neighborhood desirability. Routes, hours, admissions and conditions should be independently checked.
Representation + value
This page is general information and does not create agency. Representation requires the applicable brokerage process and written agreement when required. A property’s value requires current, property-specific evidence; public estimates and broad medians are not appraisals.
Sources
APA 7th edition reference notes
- Arizona Office of Economic Opportunity. (2025). July 1, 2025 Arizona population estimates [PDF]. Source ↗
- Arizona Regional Multiple Listing Service. (2026, July 13). July 2026 STAT report. Source ↗
- California Association of REALTORS®. (2026). California home sales rebound in June, C.A.R. reports. Source ↗
- Northern Arizona Association of REALTORS®. (2026). Northern Arizona Association of REALTORS®. Source ↗
- Coconino County. (n.d.). Helpful links: Community and public-safety resources. Source ↗
- Realtor.com Economic Research. (2026). Coconino County, Arizona housing market summary: June 2026. Source ↗
- Realtor.com Economic Research. (2026). Phoenix, Arizona housing market summary: June 2026. Source ↗
- Realtor.com Economic Research. (2026). Orange County, California housing market summary: June 2026. Source ↗
- U.S. Census Bureau. (2026). Metropolitan and micropolitan statistical area population totals: 2020–2025. Source ↗
- U.S. Census Bureau. (n.d.). QuickFacts: Orange County, California. Retrieved August 12, 2026, from Source ↗
- National Park Service. (n.d.). Grand Canyon National Park. Source ↗
- City of Sedona. (n.d.). GIS maps and interactive viewer. Retrieved August 12, 2026, from Source ↗
- U.S. Forest Service. (n.d.). Coconino National Forest: Tribal relations. Source ↗
Page reviewed August 12, 2026. Metro and combined statistical area figures are from U.S. Census Bureau Vintage 2025 tables. Arizona place and county figures are from the Arizona Office of Economic Opportunity. Brokerage/MLS data available to a client at the time of inquiry may be newer and may use different boundaries or property definitions.
Destination photo credits + licenses
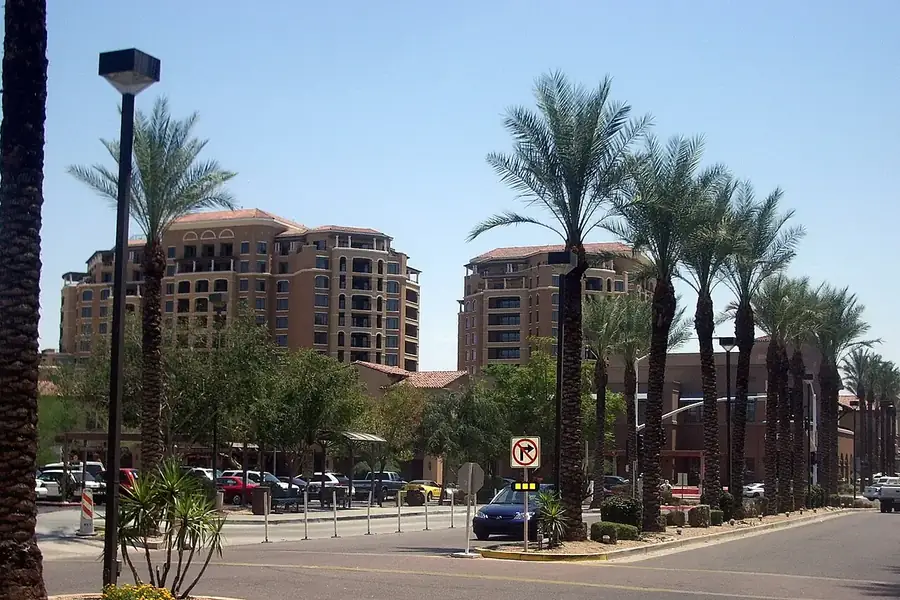
- Scottsdale Waterfront: Joseph Plotz, Public domain; cropped and color-toned for this page.
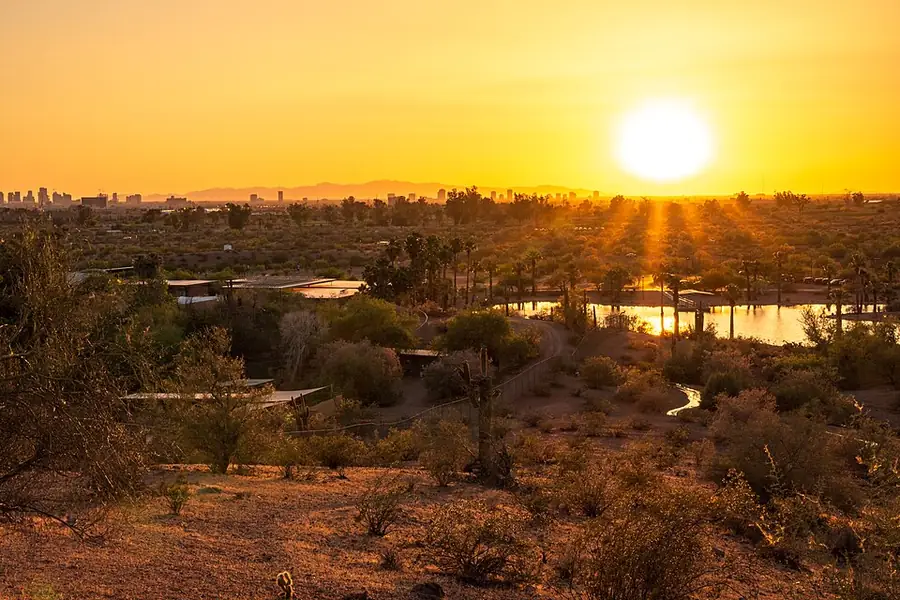
- Papago Park: dconvertini, CC BY-SA 2.0; cropped and color-toned for this page.
- Arizona State University: Daderot, CC0; cropped and color-toned for this page.
- Grand Canyon National Park: Romain Guy, CC0; cropped and color-toned for this page.
- Historic Downtown Flagstaff: Ken Lund, CC BY-SA 2.0; cropped and color-toned for this page.
- Lowell Observatory: Molly Craycroft, CC BY-SA 4.0; cropped and color-toned for this page.
- Crystal Cove State Park: NorbertNagel, CC BY-SA 4.0; cropped and color-toned for this page.
- Newport Harbor: Don Ramey Logan, CC BY 4.0; cropped and color-toned for this page.
- Mission San Juan Capistrano: NorbertNagel, CC BY-SA 4.0; cropped and color-toned for this page.
Licensed representation
Arizona through HomeSmart, LLC. California through HomeSmart Evergreen Realty.